2014年10月31日 星期五

Post4 - Somethings about Recommender Systems

Recommender systems became  a very not and interesting topic in IT field nowadays. The value is created on its profitable applications of data science in the big data. The source of the training data is collected from the historical search, browse, purchase and customer feedback pattens. All of these training data can be converted into golden opportunities for ROI (Return On Innovation and Investment). Then the predictive analytics tools can be created to predict the marking tends and customer behavior. It can help to decide the marketing strategy and enhance the customer experiences.

After the lecture I did some research on the underlying principles, data science, history, and design pattern.

Here are a on line article which is talking about the design pattern for the recommendation systems.
Firstly, recommender systems are essentially predictive analytics engines. It is starting with some training data which is collected from end customer or users. There are an important assumption - the web usage and purchase patterns of a particular customer relative to previous customers and a variety of similarity calculations, the engine can predict what each particular customer is most likely to do next, such as what is their next page or what items will be purchased next.
The analytics engines basically is constructed by historical logs and a supervised machine learning algorithm.


 Design Patterns for Recommendation Systems

The definition of Design Patterns is "a general repeatable solution to a commonly occurring problem; a description or template for how to solve a problem that can be used in many different situations." So for our recommendation system is how to design a recommendation engine.
There are 4 different design patterns for the recommendation engine design:
co-occurrence matrices, vector space models, Markov models, and "everyone gets a pony (the most popular item)".


1. The co-occurrence matrix is the cross-matrix of all possible product pairs product A and product B that were co-purchased by prior customers. Analysis of non-zero elements in this matrix identifies which co-occurrences are anomalous, that is, are more frequent than you would expect by independent occurrence of items. These anomalous co-occurrences become indicators for potential offers of product B for customers who buy product A. This approach is based upon the association rule mining algorithm.


2.  Vector space models are used to describe customer modeling and product modeling. This begins with building a feature vector, consisting of either a set of features that describe a customer such as products of interest, features of interest, manufacturers of interest, purchase frequency, price range, etc. or a set of features that describe a product . Cosine similarity calculations are then made against these feature vectors to identify similar customers (X,Y) and similar products (A,B). In the first case, products are offered to customer X based upon the purchase history of similar customer Y. In the second case, the customer is offered product A based upon its similarity to product B that the customer has previously purchased or has recently looked at (but not purchased).


 3. Markov models are a form of probabilistic model that can be used to predict elements of a sequence, usually a temporal sequence (e.g., the weather, the stock market, network traffic, web clicks within a site, or purchase patterns). Markov models have a restricted form, mathematically speaking, and this restriction can sometimes make it possible to learn a Markov model from past data (training data). This model can be used to predict probabilities of future events, such as the next most likely thing that the customer will do or buy.


4. "Everyone Gets a Pony?" this model is the world?s simplest. After you find the items that everyone likes and nearly everyone else has purchased, then you offer those items to every new customer, since they too may buy them. This "Top 40" model is not very interesting and does not require a complex learning model, but the product may be a guaranteed seller. Such a simplistic model may be most useful in on line stores that have a specific branding and that also have other popular items that customers may not be aware of. Consequently, you want to make customers aware of those popular off-brand items while they are still shopping in your store.


2014年10月17日 星期五

Post 3 - Advantages and Disadvantages of RageRank and HITS

PageRank

PageRank is a link analysis algorithm which is invented is Sergey Brin and Larry Page. This PageRank algorithm is using a recursive scheme which is similar to Kleinberg's HITS  algorithm but PageRank calculate the page ranking by know the webpage  linking relationships. The ideal is very simple, it assumed s page is important if it is pointed by other important pages. The PageRank algorithm decided that the ranking score of a page is determined by summing up all the ranking score of all the pages that pointed at that page. This algorithm is reviewing and weighting all the elements which is posted on a page.

Here are some maths. for the PageRank algorithm. Ref from 3.2
http://www.slideshare.net/shatakirti/pagerank-and-hits


HITS

HITS is developed by Jon Kleinberg, he is a professor in the Department of Computer Science at Cornell. HITS is designed to solve the Web Search problem. The HITS algorithm is making use of the link structure of the web in order to rank the page relevant for a particular searching keyword.  

Here are some maths. for the HITS algorithm. Ref from 2.4


Advantages and Disadvantages of RageRank and HIT

After the lecture on 17 Oct, we went thought the RageRank and HITS algorithm. So
let us discuss more about the advantages and disadvantages of PageRank and HITS.


Advantages of PageRank


1. PageRank algorithm make the webpage link analytic become more robust.
2. PageRank is a global scale measurement
3. PageRank is query independent.

Disadvantages of PageRank


1. Older pages may have higher rank. It is because a new page even have some very good contents but it may not have many links in the early state.
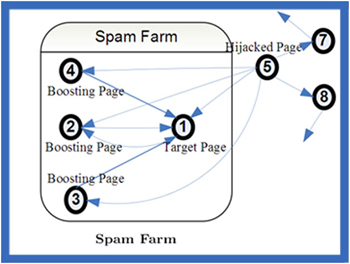
2. PageRank can be easily increased by the "link-farms"  see figure 1

Link-Farms(definition from http://en.wikipedia.org/wiki/Link_farm) - link farm is any group of web sites that all hyperlink to every other site in the group.[1] In graph theoretic terms, a link farm is a clique.


figure 1

3. Rank can be raised by buying "links".


Advantages of HITS

1. Allow query by topics, which may be able to provide more relevant authority and hub pages.
2. Allow to build the adjacency matrices from the neighbourhood graphs and power iterations does not present any computational burdens.

Disadvantages of HITS

1. Neighbourhood graphs must must need to constructed in "On-Fly" manner.
2. it suffers from topic-drift.
The neighbourhood graphs N could contain nodes which have high authority scores  for a topic unrelated to the original query.
3. HITS can not detect advertisement.
4. HITS can easily be spammed by adding out-links in one's own page.
5. The query time is slow. It is because  "On-Fly" neighbourhood graphs creation.
 

2014年10月2日 星期四

Post 2 - Study "Clustering using K-Means"

What is K-means clustering?

The K-means clustering algorithm was developed by MacQueen. This algorithm is aimed to partition a set of objects based on  their characteristics. After that the object can be partitioned into k clusters, where k is a predefined constant. We need a reference point to identify a clusters and this reference point is our k centroid. The centroid of a cluster is formed by the relative distance of all the object in that cluster.

Simple implementation of Lloyd’s algorithm for performing k-means clustering in python:
import numpy as np
 
def cluster_points(X, mu):
    clusters  = {}
    for x in X:
        bestmukey = min([(i[0], np.linalg.norm(x-mu[i[0]])) \
                    for i in enumerate(mu)], key=lambda t:t[1])[0]
        try:
            clusters[bestmukey].append(x)
        except KeyError:
            clusters[bestmukey] = [x]
    return clusters
 
def reevaluate_centers(mu, clusters):
    newmu = []
    keys = sorted(clusters.keys())
    for k in keys:
        newmu.append(np.mean(clusters[k], axis = 0))
    return newmu
 
def has_converged(mu, oldmu):
    return (set([tuple(a) for a in mu]) == set([tuple(a) for a in oldmu])
 
def find_centers(X, K):
    # Initialize to K random centers
    oldmu = random.sample(X, K)
    mu = random.sample(X, K)
    while not has_converged(mu, oldmu):
        oldmu = mu
        # Assign all points in X to clusters
        clusters = cluster_points(X, mu)
        # Reevaluate centers
        mu = reevaluate_centers(oldmu, clusters)
    return(mu, clusters)

def init_board_gauss(N, k):
    n = float(N)/k
    X = []
    for i in range(k):
        c = (random.uniform(-1, 1), random.uniform(-1, 1))
        s = random.uniform(0.05,0.5)
        x = []
        while len(x) < n:
            a, b = np.array([np.random.normal(c[0], s), np.random.normal(c[1], s)])
            # Continue drawing points from the distribution in the range [-1,1]
            if abs(a) < 1 and abs(b) < 1:
                x.append([a,b])
        X.extend(x)
    X = np.array(X)[:N]
    return X 
p_N2000_K15_

Application of Clustering using K-Means

There are many clustering approaches can be used to analyses web contents such as text-based clustering, link-based clustering and graph based clustering.

Text-based clustering is based on the content of web document. The basis idea is that if two document contain many common words then it can be defined that two document are very similar. The text-based approaches can be further classified according to different clustering method such as partitional, hierarchal or graphical based.

Partitional clustering
The partitional document clustering approach attempt a flat partitioning of a set of documents into a predefined number of disjoint cluster. The most common partitional clustering algorithm is k-means, which relies on the idea of centroid can be a good representation of the cluster.

Graph based clustering
This clustering is relied on the edge detection. Each node represents a document and there exists an edge between two nodes if the document similarity between documents in different clusters. The basic idea is that the weights of the edges in the same cluster will be greater than the weights of the edges across clusters.The advantages of these approaches are that can capture the structure of the data and that they work effectively in high dimensional spaces. The disadvantage is that the graph must fit the memory.

2014年9月21日 星期日

Post 1 - Understanding what is "Social Media Analytics"

Basis ideas of Social Media Analytics

In lecture 1, we discussed what are social media and what is social media analytics.  
We used the definition of social media as a starting point to start the discussion of how we can analyse the complicated reaction within the social media.

Web 2.0 and User Generated Content (UGC) are two elements to drive Social Media. Social media is a global phenomenon, it enabled the information sharing between a groups and communities. People are enable express their views,interest, religion and opinions via the social media. Social media offers a place to let us to understand people and their behaviour, it also provided us a method to use the macro point of view to analyse global phenomenon.

Social media analytic is an engineering point of view to develop and evaluate the information tools and frameworks to extract, analyse, summarise and visualise information.  During the discussion of "Case Studies 3 - How can we improve face recognition using social network information", face recognition system is alway perform badly in different pose, illumination and expression but social media information such as friendship information can improve the face recognition algorithm. It mean that the system can "guess" the face more accurate by knowing the relationship.  Through this cases we can learn that the social media analytics data is not just a "output" it can also be a "input" to improve a real social media system.